Chart Studio lets you create, style, and save custom SVG charts linked to Excel data sources. It provides a central workspace for mapping data, formatting charts, and managing saved charts. Because charts remain linked to their Excel data sources, you can keep them aligned with the underlying data
Chart Manager
The Chart Manager in the Integrate widget is the central location for creating and managing charts. From Chart Manager, you can:
-
Select an Excel data source to create a chart.
-
Access charts you have already created.
-
Download charts as editable SVG files for use in project documents.
How to build charts in Chart Studio
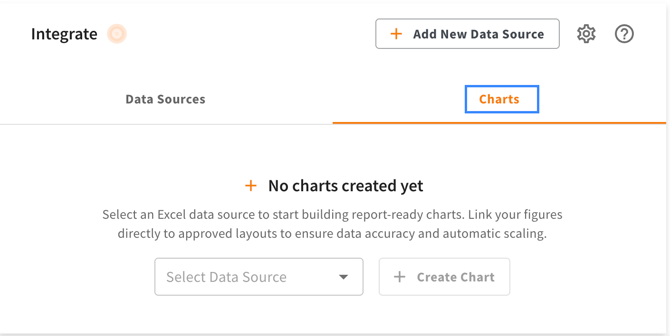
Navigate to Charts tab in Integrate section.
Choose the Excel data source you want to create charts from in the Select Data Source dropdown and then click Create Chart. Please note that you need data source permissions (Viewer or Editor) to be able to make charts using the data source.
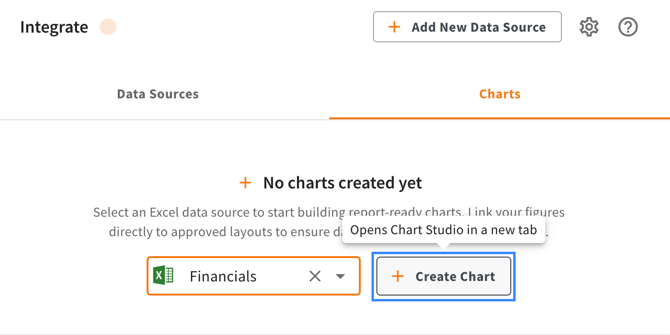
This will open the Chart Studio in a new browser. You can start building your chart here.
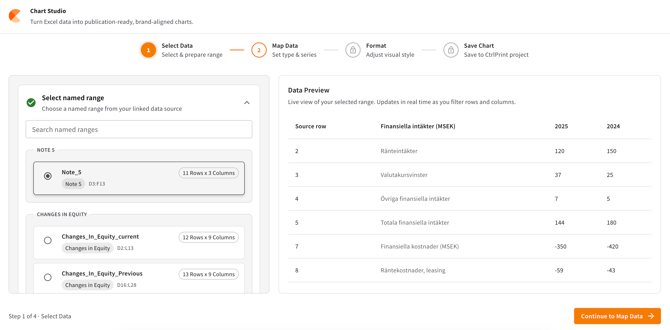
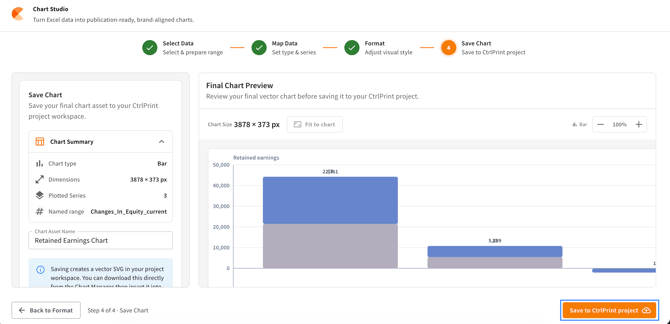
Once you have completed all the necessary steps to select the data, map data and format your chart, you can click "Save to CtrlPrint project" to save the SVG file back to the server.
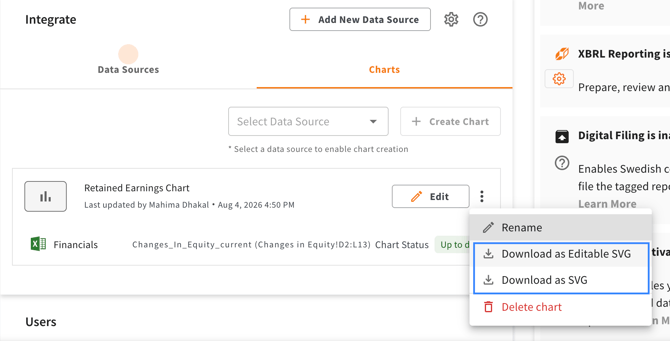
You can see the chart in your Chart Panel and see the option to download it as Editable SVG or just SVG file.
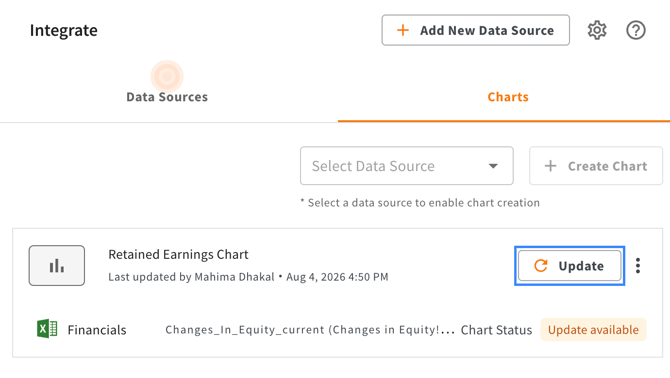
When you have a new update in the data, you can see that there is an update available for your chart. You can then click on the "Update" button and update your data with the latest data changes and easily save it to the project.